Feature Demo: Aggregating Data
Welcome to this demo page where one more special sparksnake feature will be shown: the usage of a method to apply multiple aggregation functions in a Spark DataFrame.
Let's see a summary of what we will be talking about:
| 🚀 Feature | Extraction of multiple aggregate statistics from a numerical attribute in a Spark DataFrame based in a group by operation |
| 💻 Method | SparkETLManager.agg_data() |
| ⚙️ Operation Mode | Available in all operation modes |
Data and Context
As usual, let's first introduce the data available for this demo. In this case, we will use the payments dataset with the following schema:
root
 |-- order_id: string (nullable = true)
 |-- payment_sequential: integer (nullable = true)
 |-- payment_type: string (nullable = true)
 |-- payment_installments: integer (nullable = true)
 |-- payment_value: double (nullable = true)
If we look at the schema above, we will see attributes that tell us everything about payments from an specific order. So, let's see a sample of this DataFrame to get closer to the data.
+--------------------+------------------+------------+--------------------+-------------+
|            order_id|payment_sequential|payment_type|payment_installments|payment_value|
+--------------------+------------------+------------+--------------------+-------------+
|b81ef226f3fe1789b...|                 1| credit_card|                   8|        99.33|
|a9810da82917af2d9...|                 1| credit_card|                   1|        24.39|
|25e8ea4e93396b6fa...|                 1| credit_card|                   1|        65.71|
|ba78997921bbcdc13...|                 1| credit_card|                   8|       107.78|
|42fdf880ba16b47b5...|                 1| credit_card|                   2|       128.45|
+--------------------+------------------+------------+--------------------+-------------+
only showing top 5 rows
And now, let's suppose we have the following business questions to answear:
What kind of data insights can be taken from this payments data?
- Can we apply a simple aggregation step such as the sum of the payment value for each payment type?
- What if we want to extract multiple aggregations such as sum, mean, min and max payment values for each payment type? It would be possible to do that in a single method call?
- Can we apply a group by operation using multiple columns, such as summarizing the payment value for each order id and payment type?
- Can we see how many distinct payment types do each order id have?
Let's see the agg_data() method in action!
SparkETLManager class setup
Before we move to the method demonstration, let's import and initialize the SparkETLManager class from sparksnake.manager module. As this feature is presented in the sparksnake's default mode (and so any operation mode can use it too), the class initialization is quite simple.
Importing and initializing the SparkETLManager class
🎬 Demonstration:
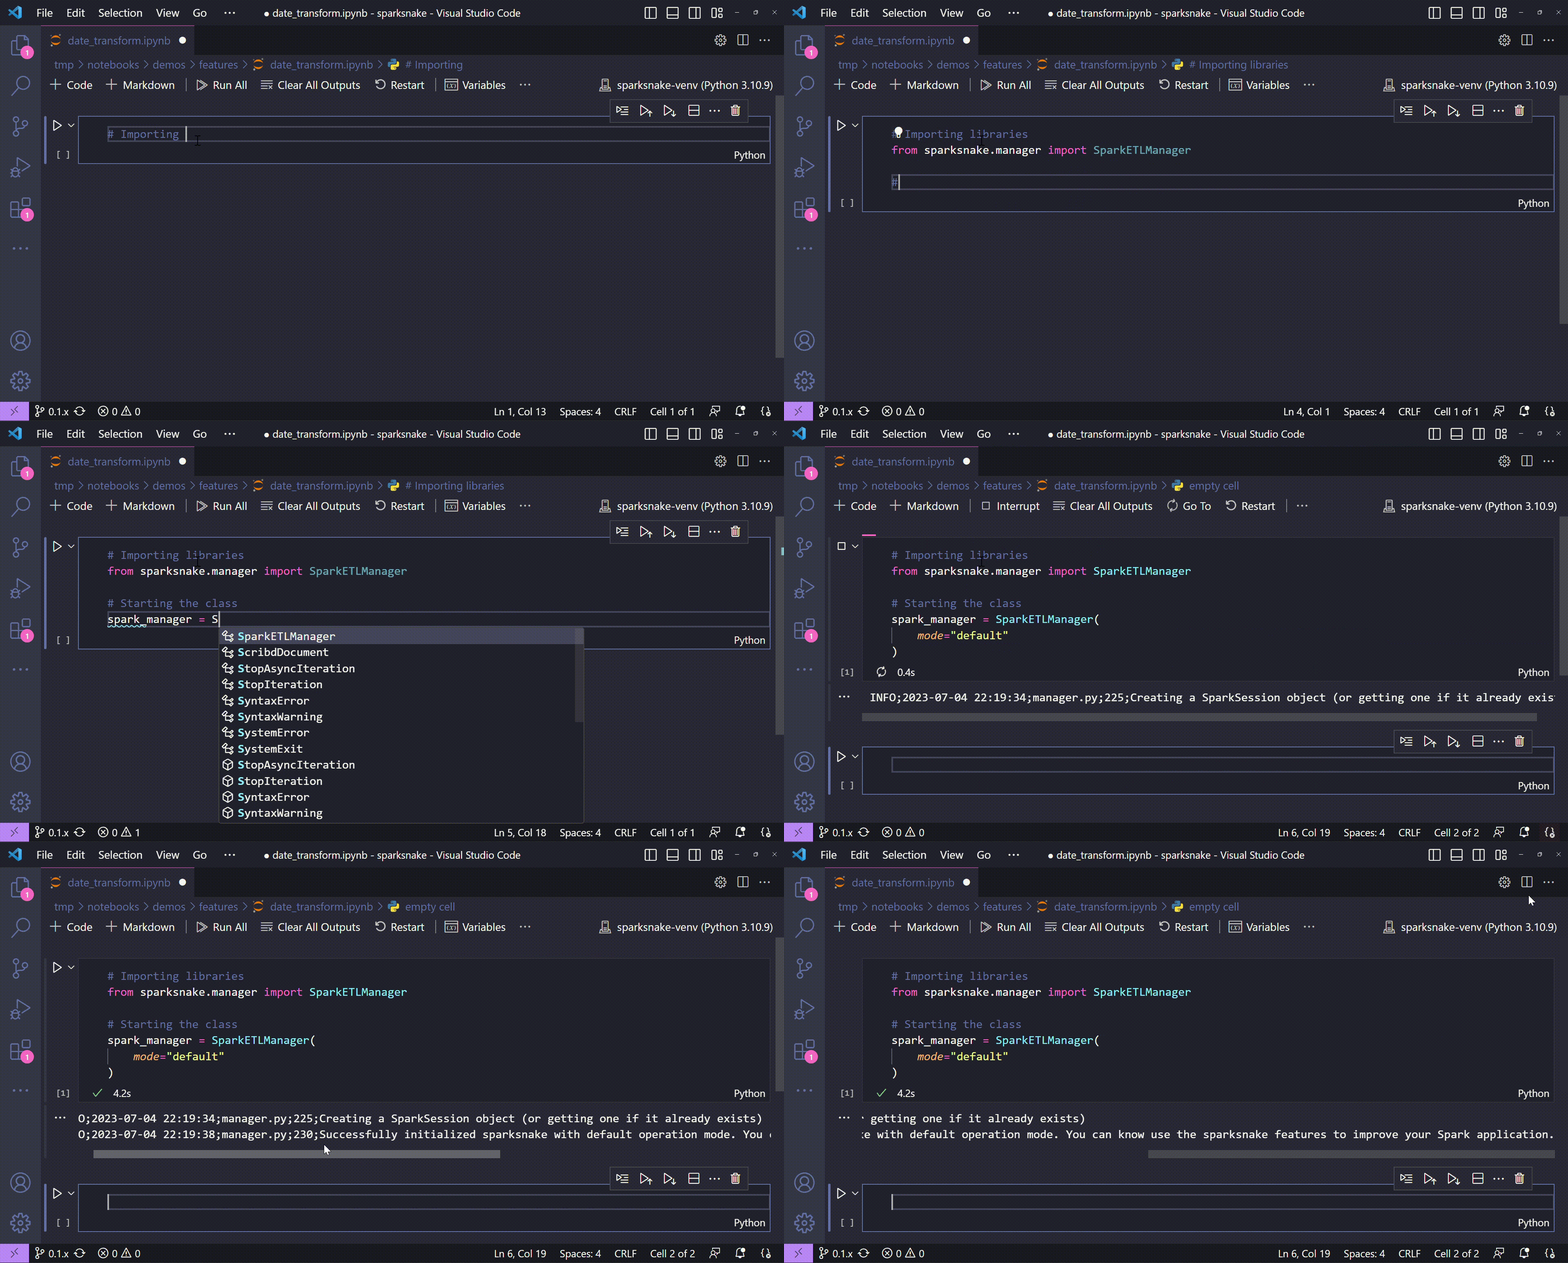
🐍 Code:
# Importing libraries
from sparksnake.manager import SparkETLManager

# Starting the class
spark_manager = SparkETLManager(
    mode="default"  # or any other operation mode
)
So, assuming we already have a Spark DataFrame object df_payemnts with the attributes shown in the previous section, we can finally start the demo showing some powerful ways to enhance the data aggregation steps using the agg_data() method.
The agg_data() method
From now on, we will deep dive into the possibilities delivered by the agg_data() method. For each new subsection of this page, a different application of the method will be shown with a hands on demo. The idea is to provide a clear view of all possibilities available in the method and to show everything that can be done with it.
If you haven't already taken a look at the method's documentation, take your chance to understand how we will configure its parameters in order to achieve all of our goals. Just to summarize it, when calling the agg_data() method we have the following parameters to configure:
spark_sessionto run a SparkSQL statement to aggregate the data following all user inputsdfto serve as a target DataFrame to be transfomed (grouped / aggregated)agg_colto set up a target column to be aggregatedgroup_byto set up a target column (or a list of columns) to be used in the group by clauseround_resultto optionally round the aggregation resultsn_roundto optionally configure the rounding on the aggregation results
We also have the **kwargs parameter that works similar to the **kwargs in the date_transform() method. Here we have the chance to pass any supported pyspark aggregation function to be applied on method call. Let's say, for instance, that we want to get the max value of a given agg_col grouped by a group_by column. For that, users just need to pass the max=True as a method keyword argument.
But don't worry! The idea is to clarify all the doubts in the following demo sections. Let's go ahead!
Applying simple aggregations
Well, let's think on the simplest thing that can be done in a group by operation: the application of a aggregation function. Taking the df_payments DataFrame to the game, let's extract the sum of all payment values for each of payment types available.
Applying a simple aggregation operation
🎬 Demonstration:
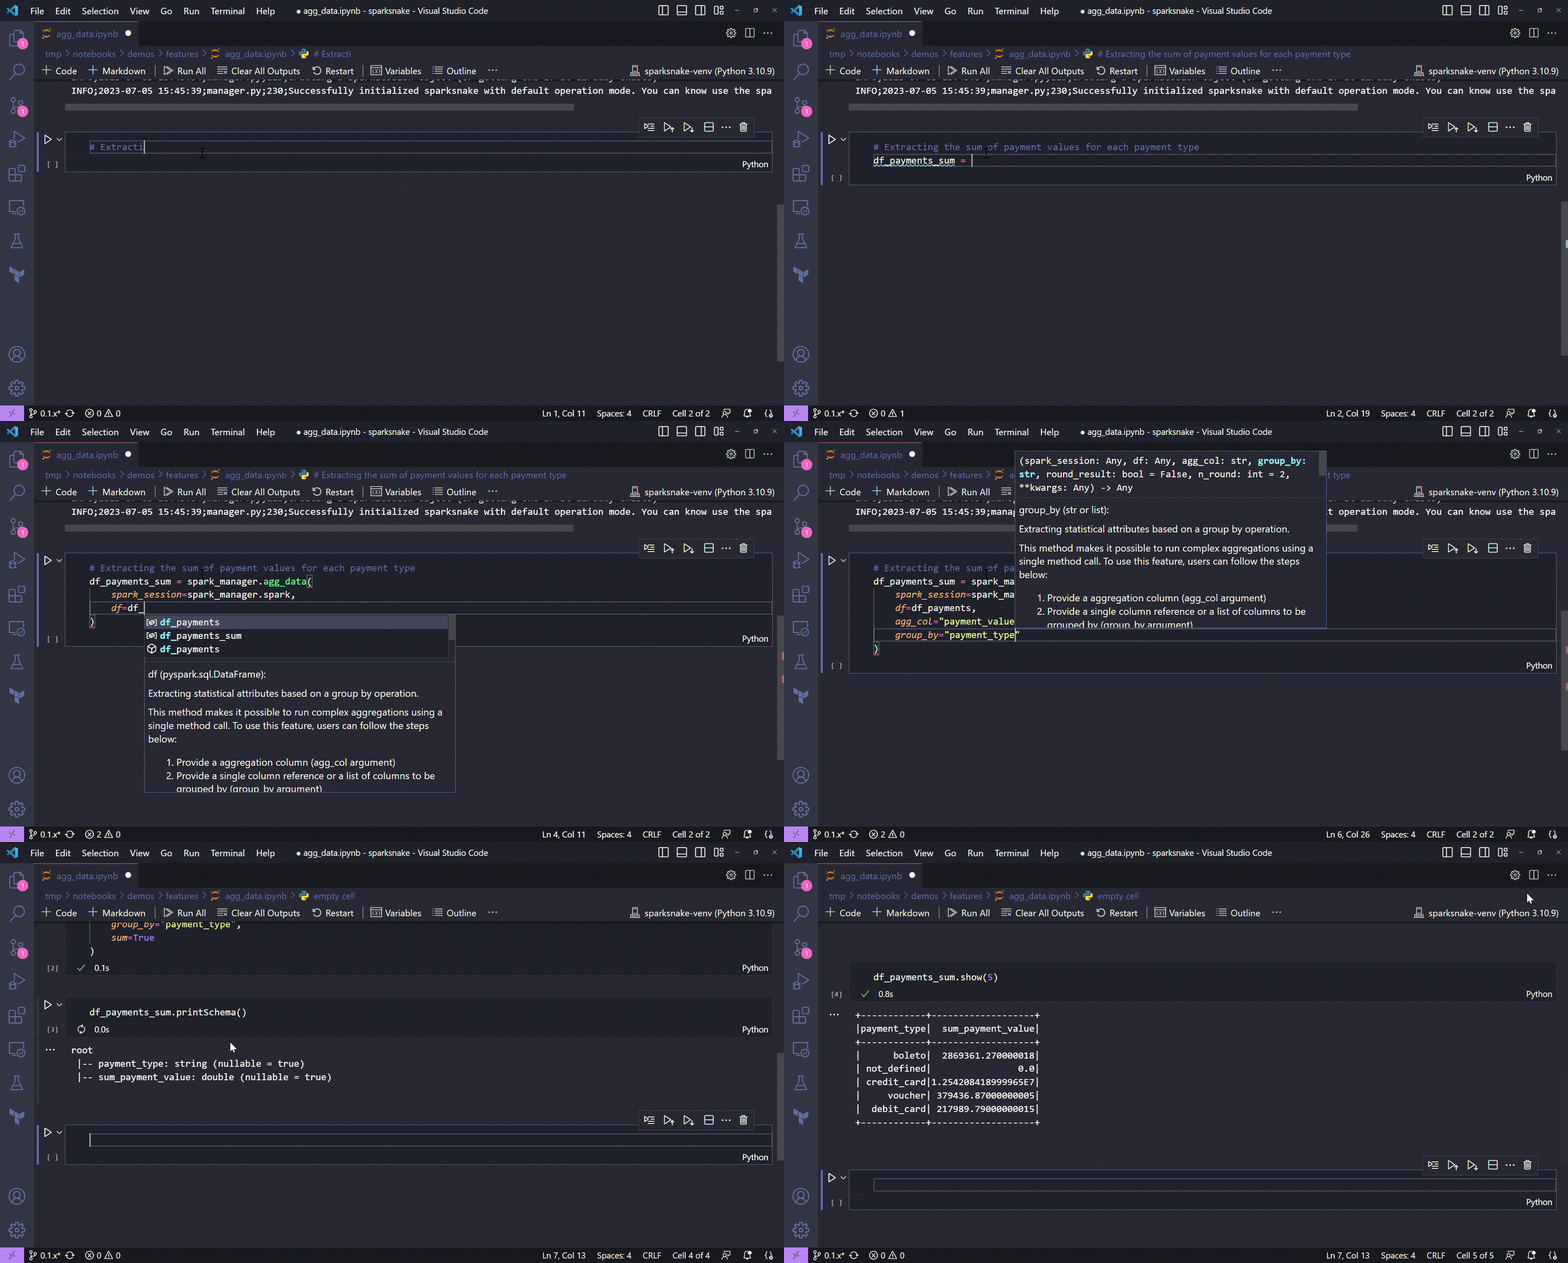
🐍 Code:
# Extracting the sum of payment values for each payment type
df_payments_sum = spark_manager.agg_data(
    spark_session=spark_manager.spark,
    df=df_payments,
    agg_col="payment_value",
    group_by="payment_type",
    sum=True
)

# Showing the schema
print("New DataFrame schema")
df_payments_sum.printSchema()

# Showing some rows
print("Sample of the new DataFrame")
df_payments_sum.show(5)
Is quite intuitive to imagine the Spark DataFrame obtained with this method application. Let's first take a look at its schema:
root
 |-- payment_type: string (nullable = true)
 |-- sum_payment_value: double (nullable = true)
Well, it seems like everything went as expected. We really got a new DataFrame with or group by column (payment_type) and the sum of all payment_values for each payment type. To confirm this, let's see a sample of the data we got:
+------------+-------------------+
|payment_type|  sum_payment_value|
+------------+-------------------+
|      boleto|  2869361.270000018|
| not_defined|                0.0|
| credit_card|1.254208418999965E7|
|     voucher| 379436.87000000005|
|  debit_card| 217989.79000000015|
+------------+-------------------+
Nice! With the agg_data() method, we could apply a simple aggregation step to extract the sum of a given column grouped by another column in a Spark DataFrame. But, we can see that the results are not so user friendly. If we can round them it could be better, right? Let's try it adding the round_result and the n_round method parameters on the call.
Rounding results in an aggregation step
🎬 Demonstration:
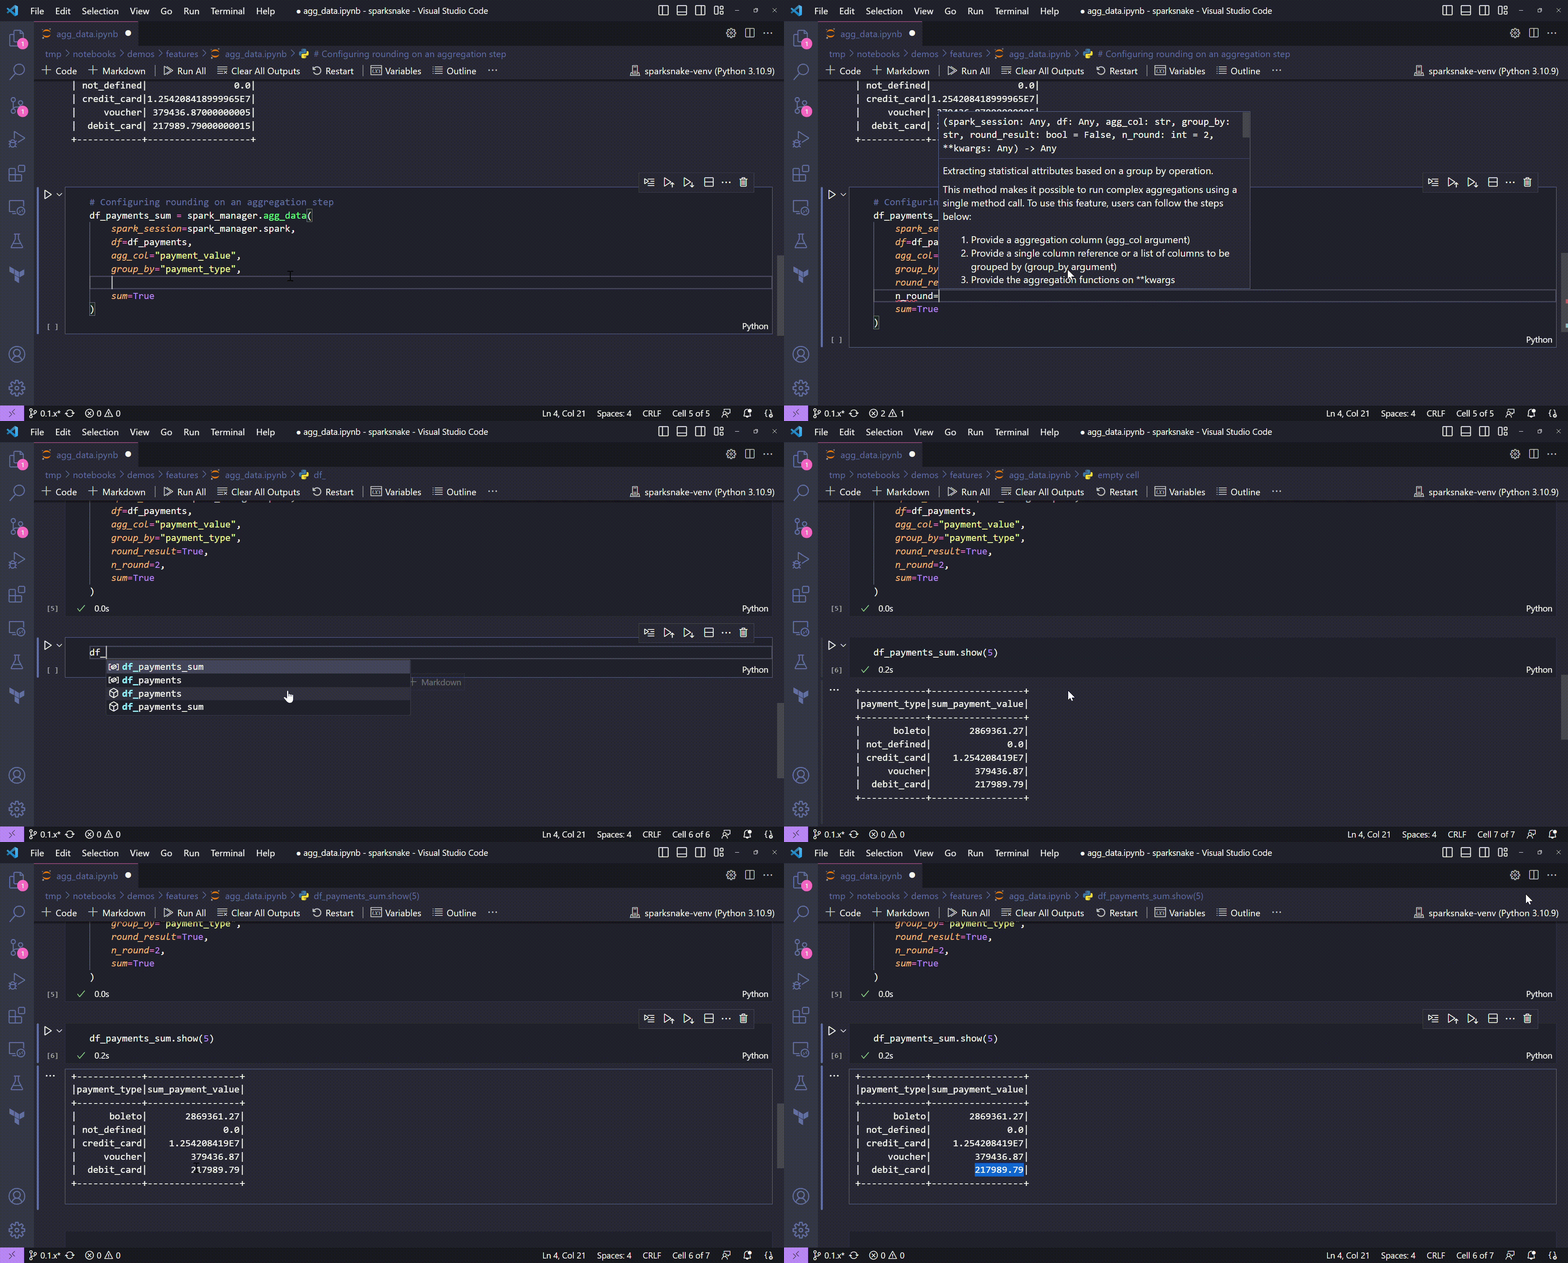
🐍 Code:
# Configuring rounding on an aggregation step
df_payments_sum = spark_manager.agg_data(
    spark_session=spark_manager.spark,
    df=df_payments,
    agg_col="payment_value",
    group_by="payment_type",
    round_result=True,
    n_round=2,
    sum=True
)

# Showing some rows
print("Sample of the new DataFrame")
df_payments_sum.show(5)
By adding those two parameters, our data is now more readable:
+------------+-----------------+
|payment_type|sum_payment_value|
+------------+-----------------+
|      boleto|       2869361.27|
| not_defined|              0.0|
| credit_card|    1.254208419E7|
|     voucher|        379436.87|
|  debit_card|        217989.79|
+------------+-----------------+
Let's see what more can be done with the good agg_data() method.
Applying multiple aggregation functions
What about an operation that demands a new Spark DataFrame with multiple aggregation functions? In other words, let's say we don't want just the sum of payment values for each available payment type, but also the mean, the maximum, the minimum payment value and also the count of payment types?
Well, the good news is that we can achieve that just by adding new keyword arguments on our method call. Take a look:
Extracting multiple aggregation functions
🎬 Demonstration:
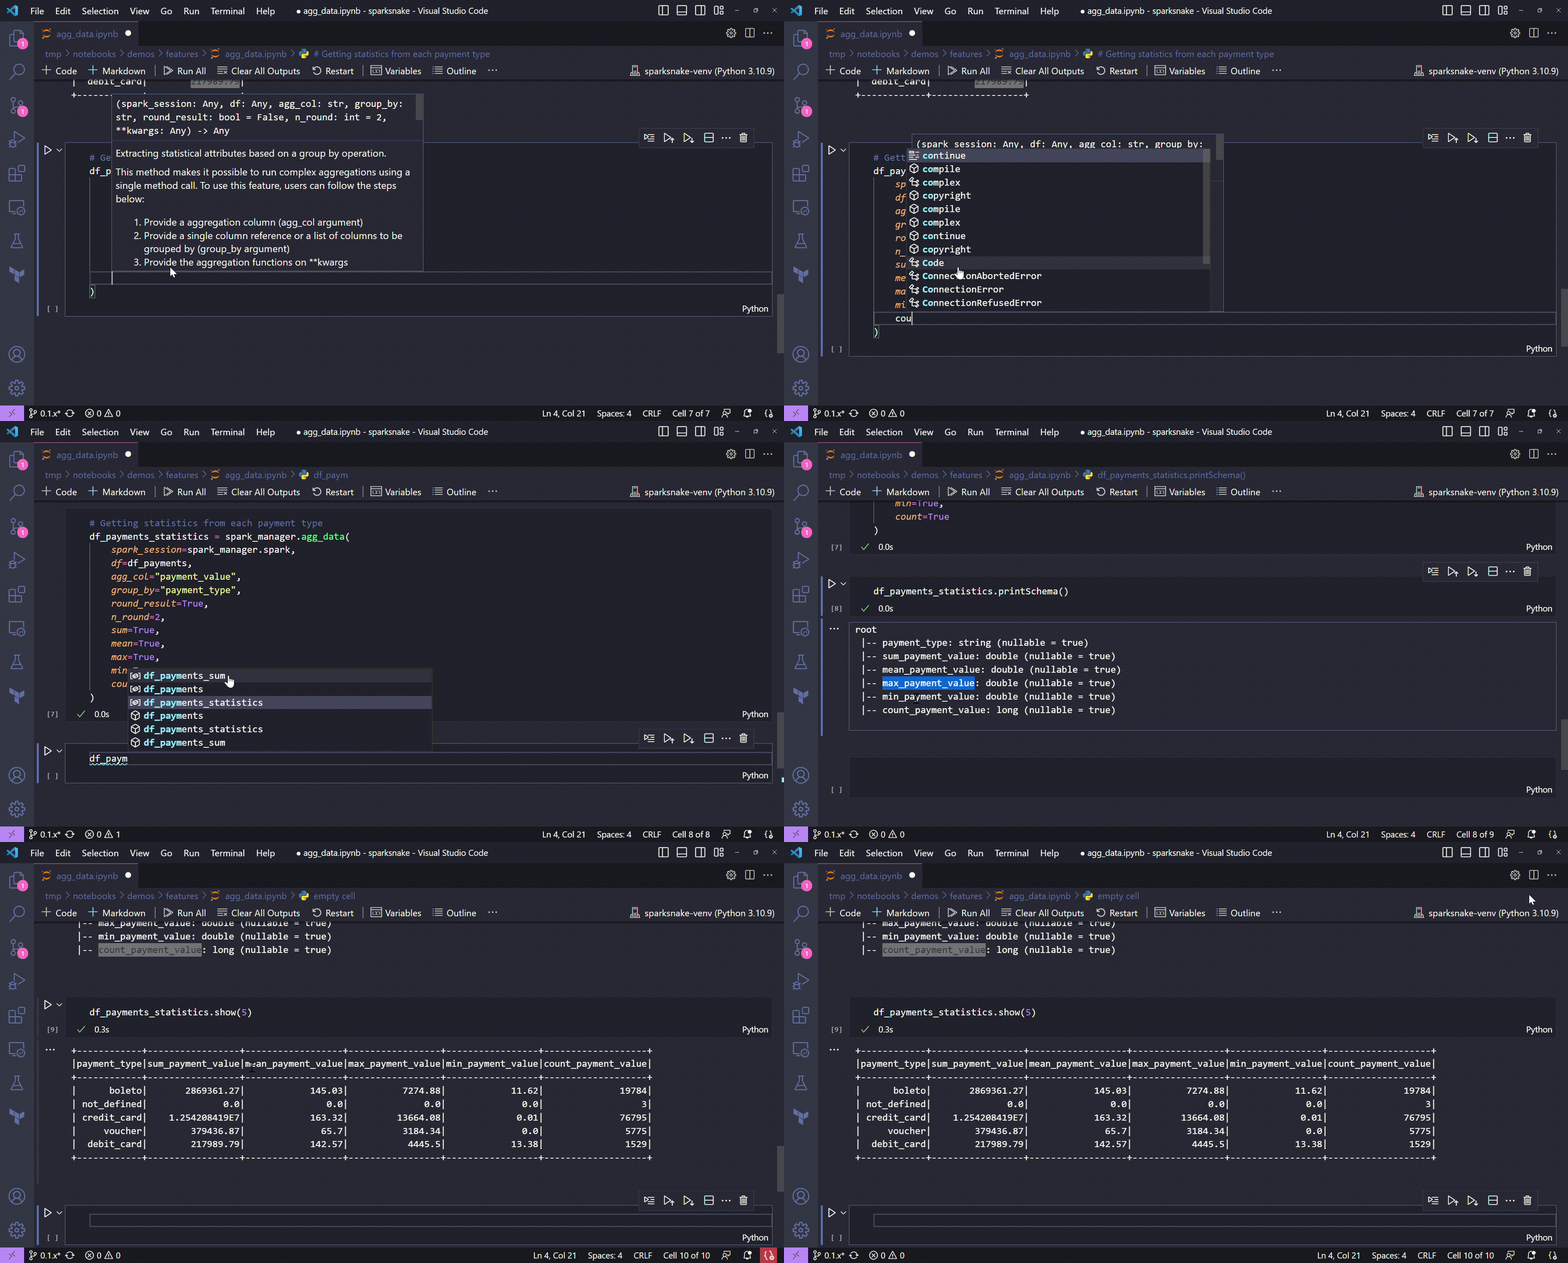
🐍 Code:
# Getting statistics from each payment type
df_payments_statistics = spark_manager.agg_data(
    spark_session=spark_manager.spark,
    df=df_payments,
    agg_col="payment_value",
    group_by="payment_type",
    round_result=True,
    n_round=2,
    sum=True,
    mean=True,
    max=True,
    min=True,
    count=True
)

# Showing the schema
print("New DataFrame schema")
df_payments_statistics.printSchema()

# Showing some rows
print("Sample of the new DataFrame")
df_payments_statistics.show(5)
And the schema of the returned DataFrame can be seen below:
root
 |-- payment_type: string (nullable = true)
 |-- sum_payment_value: double (nullable = true)
 |-- mean_payment_value: double (nullable = true)
 |-- max_payment_value: double (nullable = true)
 |-- min_payment_value: double (nullable = true)
 |-- count_payment_value: long (nullable = true)
And how about the data? Let's see a sample of the returned DataFrame to check everything worked as expected.
+------------+-----------------+------------------+-----------------+-----------------+-------------------+
|payment_type|sum_payment_value|mean_payment_value|max_payment_value|min_payment_value|count_payment_value|
+------------+-----------------+------------------+-----------------+-----------------+-------------------+
|      boleto|       2869361.27|            145.03|          7274.88|            11.62|              19784|
| not_defined|              0.0|               0.0|              0.0|              0.0|                  3|
| credit_card|    1.254208419E7|            163.32|         13664.08|             0.01|              76795|
|     voucher|        379436.87|              65.7|          3184.34|              0.0|               5775|
|  debit_card|        217989.79|            142.57|           4445.5|            13.38|               1529|
+------------+-----------------+------------------+-----------------+-----------------+-------------------+
Well, we now have a huge way to apply analytics in our DataFrames! With a single method call we could extract multiple statistical attributes based in a group by operation that was simple to build!
All possible aggregation functions
Sum, mean, max, min and count are not the only aggregation functions available in agg_data() method. The sparksnake's latest version considers the following functions available to use:
- sum
- mean
- max
- min
- count
- variance
- stddev
- kurtosis
- skewness
You can always look at the method's official documentation to check the latest status.
Grouping by multiple columns
What if we want to apply some group by operation grouping by multiple columns (and not just by one as we see by now)? Well, the agg_data() method are prepared to receive either an unique column string or a list of column names in the group_by parameter. Let's see this feature in action by applying an operation that aggregates the count of payment installments for each order id and payment type.
Grouping by multiple columns
🎬 Demonstration:
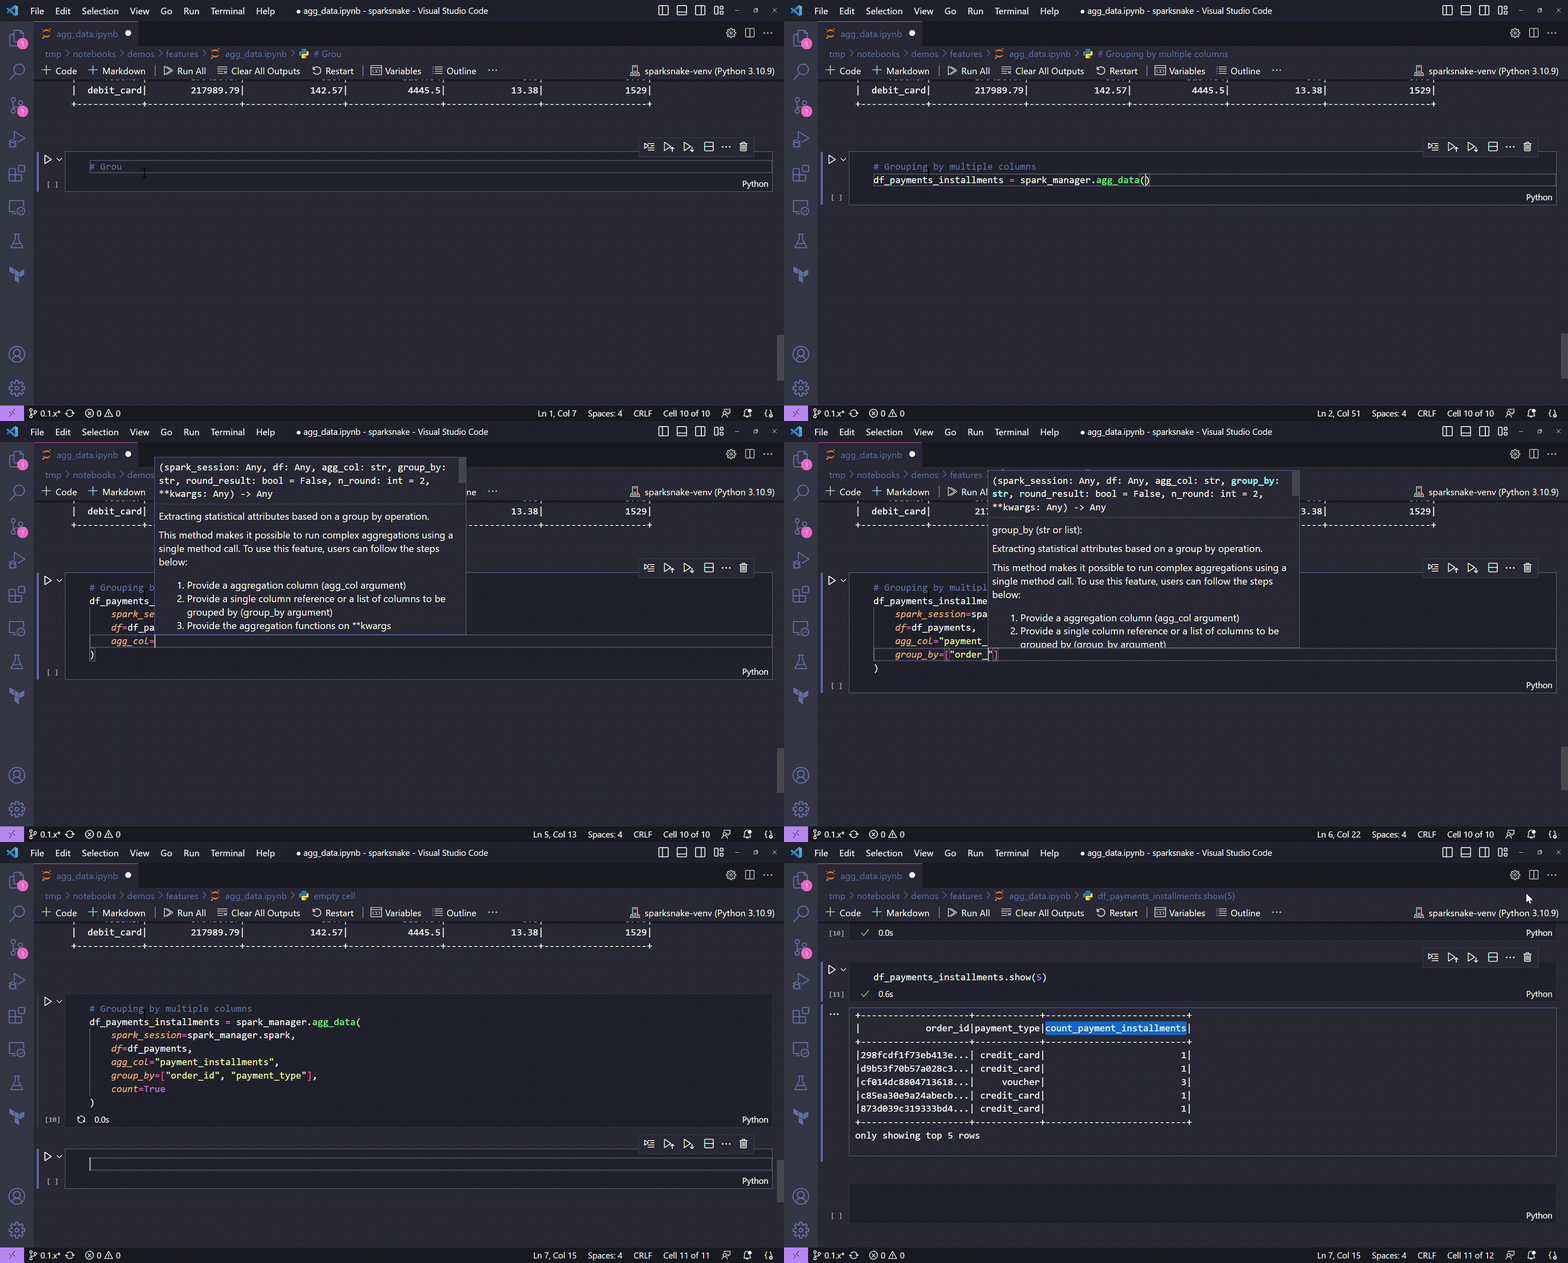
🐍 Code:
# Grouping by multiple columns
df_payments_installments = spark_manager.agg_data(
    spark_session=spark_manager.spark,
    df=df_payments,
    agg_col="payment_installments",
    group_by=["order_id", "payment_type"],
    count=True
)

# Showing the schema
print("New DataFrame schema")
df_payments_installments.printSchema()

# Showing some rows
print("Sample of the new DataFrame")
df_payments_installments.show(5)
The new DataFrame has the following data:
+--------------------+------------+--------------------------+
|            order_id|payment_type|count_payment_installments|
+--------------------+------------+--------------------------+
|298fcdf1f73eb413e...| credit_card|                         1|
|d9b53f70b57a028c3...| credit_card|                         1|
|cf014dc8804713618...|     voucher|                         3|
|c85ea30e9a24abecb...| credit_card|                         1|
|873d039c319333bd4...| credit_card|                         1|
+--------------------+------------+--------------------------+
only showing top 5 rows
And that's it for the agg_data() method demo! I hope this one can be a good way to enrich your Spark applications that uses aggregations and group by operations!